Delving Into a Complex Codebase

Delving Into a Large Codebase
(Open Energy Dashboard)
Introduction
Over the span of about a month, I transitioned into a contributing role within the Open Energy Dashboard (OED) codebase. Throughout this period, my teammates and I dedicated the majority of our time to deciphering the complexity of the code, which often proved to be confusing. In this article, I aim to explore the challenges associated with grasping a new codebase, outline my systematic approach to dissecting the issues, and illustrate how I ultimately navigated through the complexities. This month-long journey has not only honed my ability to comprehend and troubleshoot complex systems but has also equipped me with invaluable skills essential for successful collaboration within any collaborative projects.
Codebase/product
OED is a versatile web-based application engineered to display energy-related data sourced from smart energy meters or uploaded via CSV files, accessible through any standard web browser. While initially adopted by select governmental agencies, it is open to all users and designed with a user-friendly interface tailored for non-technical individuals. The motivation for developing this tool arose from a commitment to provide a complimentary dashboard supporting sustainability initiatives and addressing climate change. Below is an example of the dashboard in action after being populated with data.
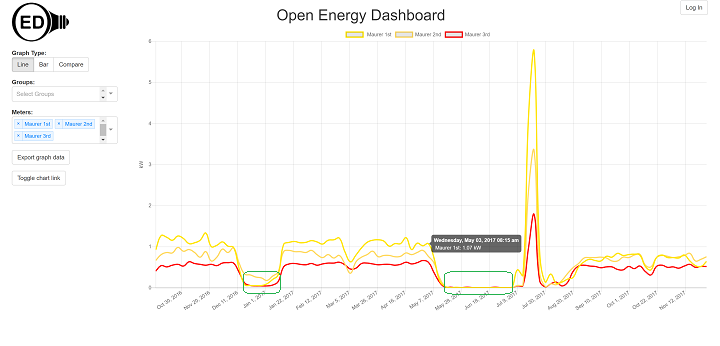
The dashboard is a useful tool for energy managers responsible for buildings, facilities, or organizations. They can use the dashboard to monitor usage trends and identify areas for improvement.
Dashboard: provides users with options to display data after being fed with files/csv’s.
The Issue
The current state of the codebase lacks any testing to ensure the accuracy of the API it relies on. Our team's issue was to implement a testing case to compare against the APIs generated data. Addressing this issue is key to validating the API's performance across diverse scenarios, thereby identifying any bugs, errors, or unforeseen anomalies.
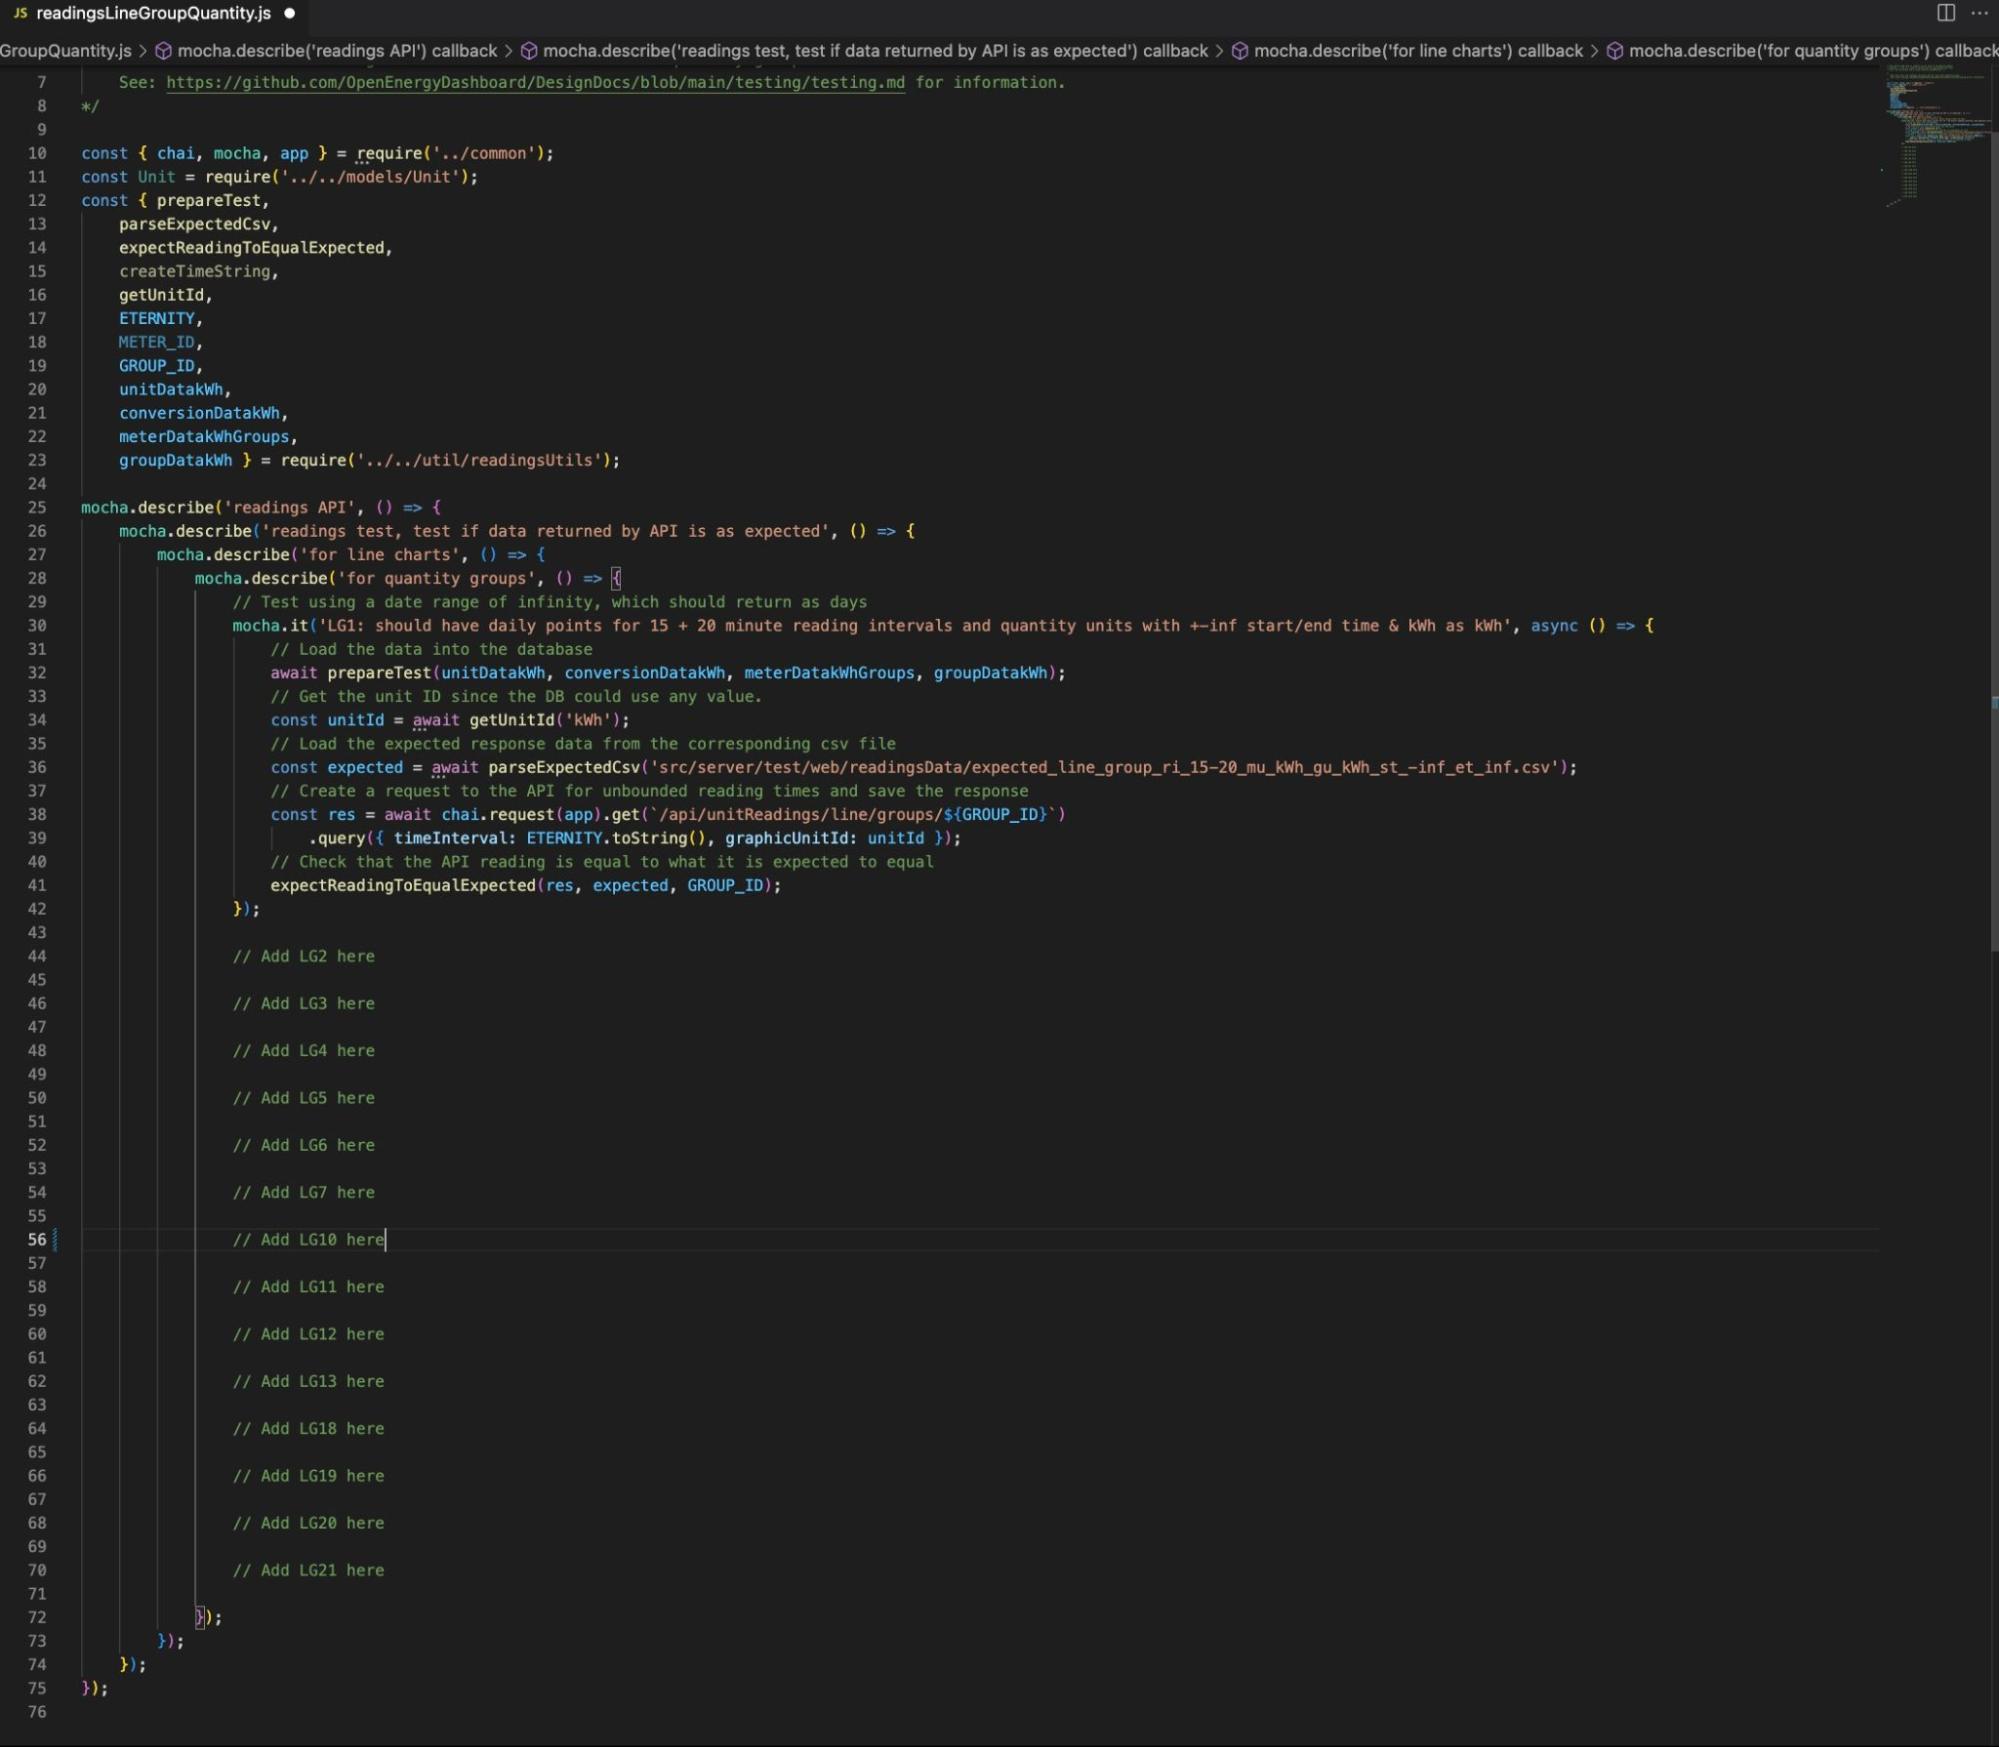
The test case should be implemented in readingsLineGroupQuantity from the OED codebase and the results will be compared with the results (res) from the API.
Although the issue did not affect the website's functionality, ensuring the accuracy of the API remains crucial, particularly for a live site serving government agencies. The implementation of the new testing case will empower users to verify and rely on the information presented on the dashboard with confidence.
System Overview
Before starting to implement the test case, we need to explore how the project functions.
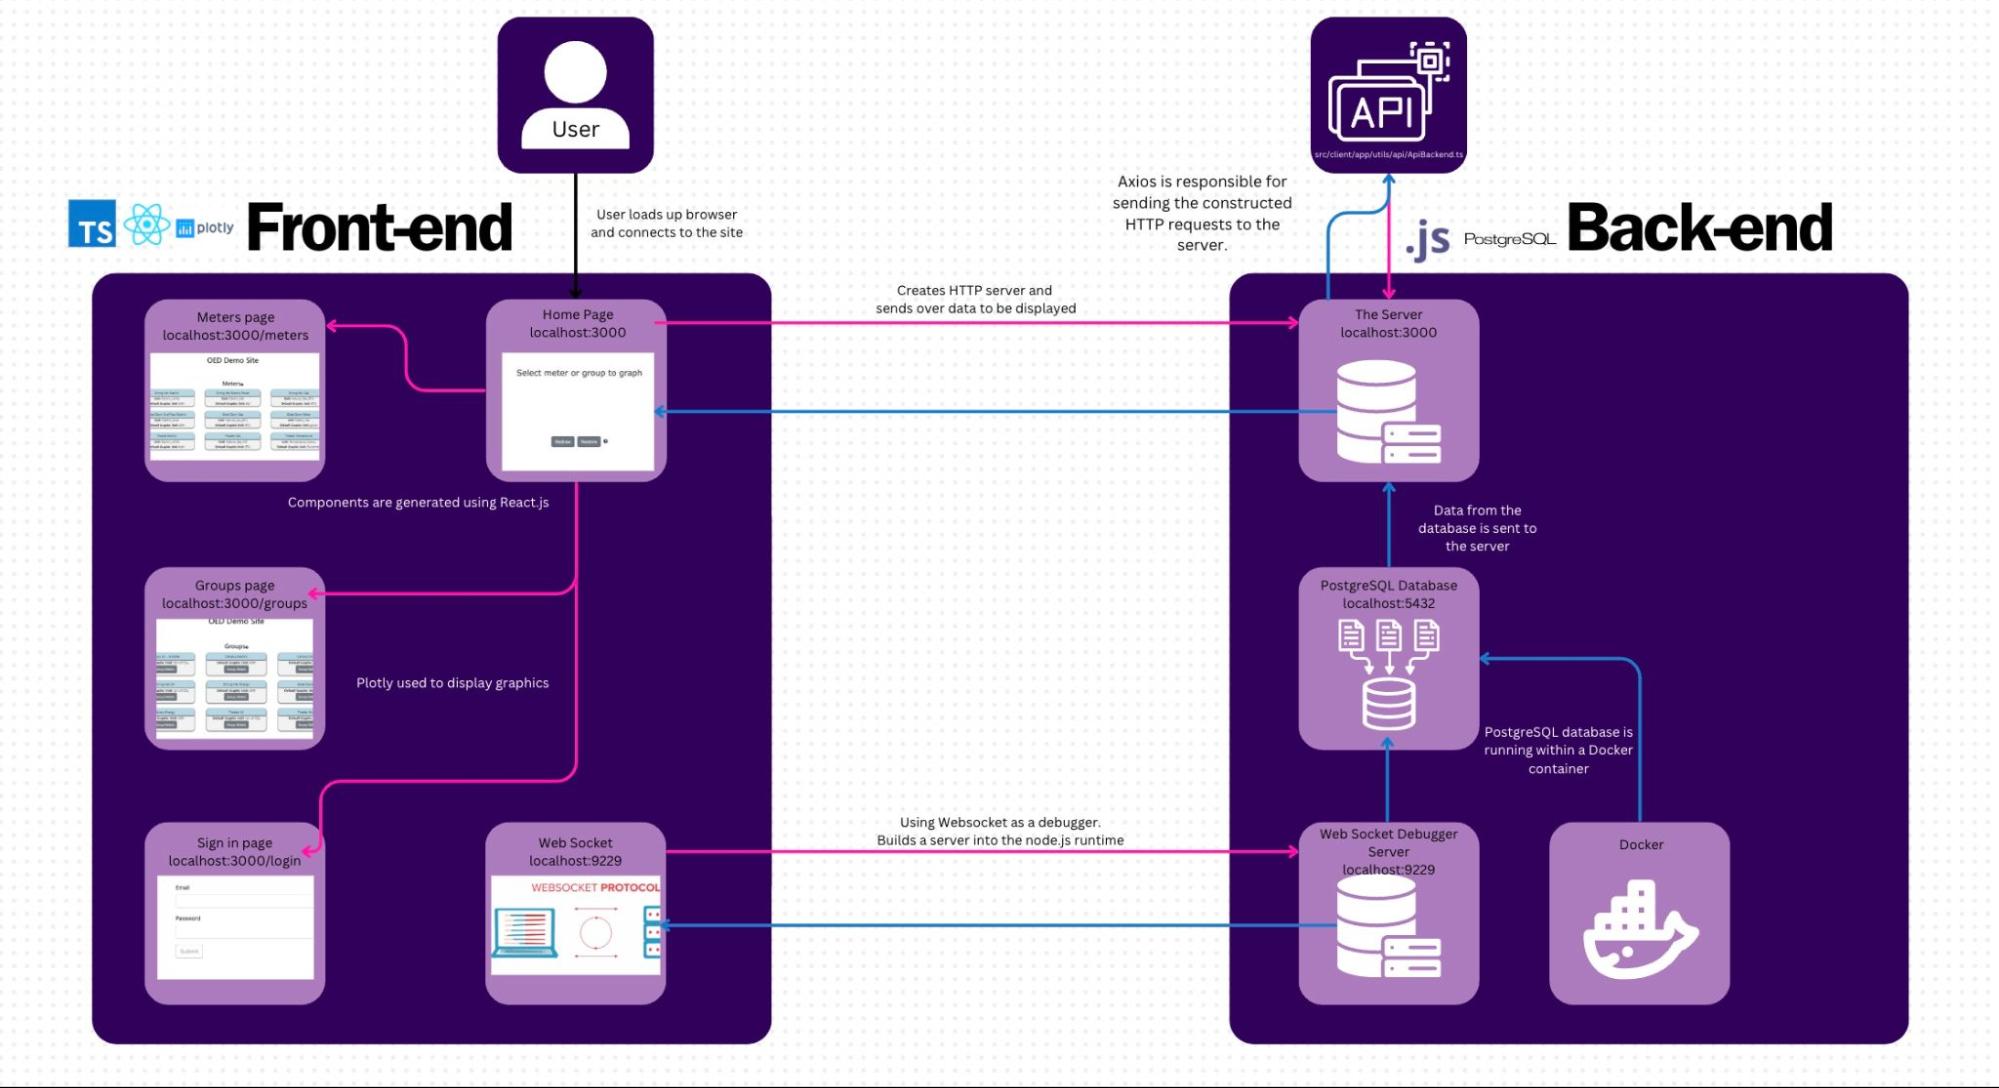
Diagram I created to summarize how the front-end and back-end functions.
Tech Stack |
Front-end | React.js (Page control): Combines components and is composed to create the UI that is displayed to the user. Redux: JavaScript library to help handle state. Plotly: Graphics are produced with Plotly using their JavaScript library. Promises: Used to help deal with the situation when some actions depend on others. |
Back-end | JavaScript: used for developing web applications. PostgreSQL: a reliable open-source database. |
Testing | Mocha: The Mocha testing framework, which provides a flexible and feature-rich environment for running tests. Chai: The Chai assertion library, which is commonly used for writing tests in JavaScript. |
Flow of Control
Understanding the flow of control (how the groups/meters page gathers the data):
1.
When the user imports data into the dashboard, the app's first step is to format the user's item for organization.
2.
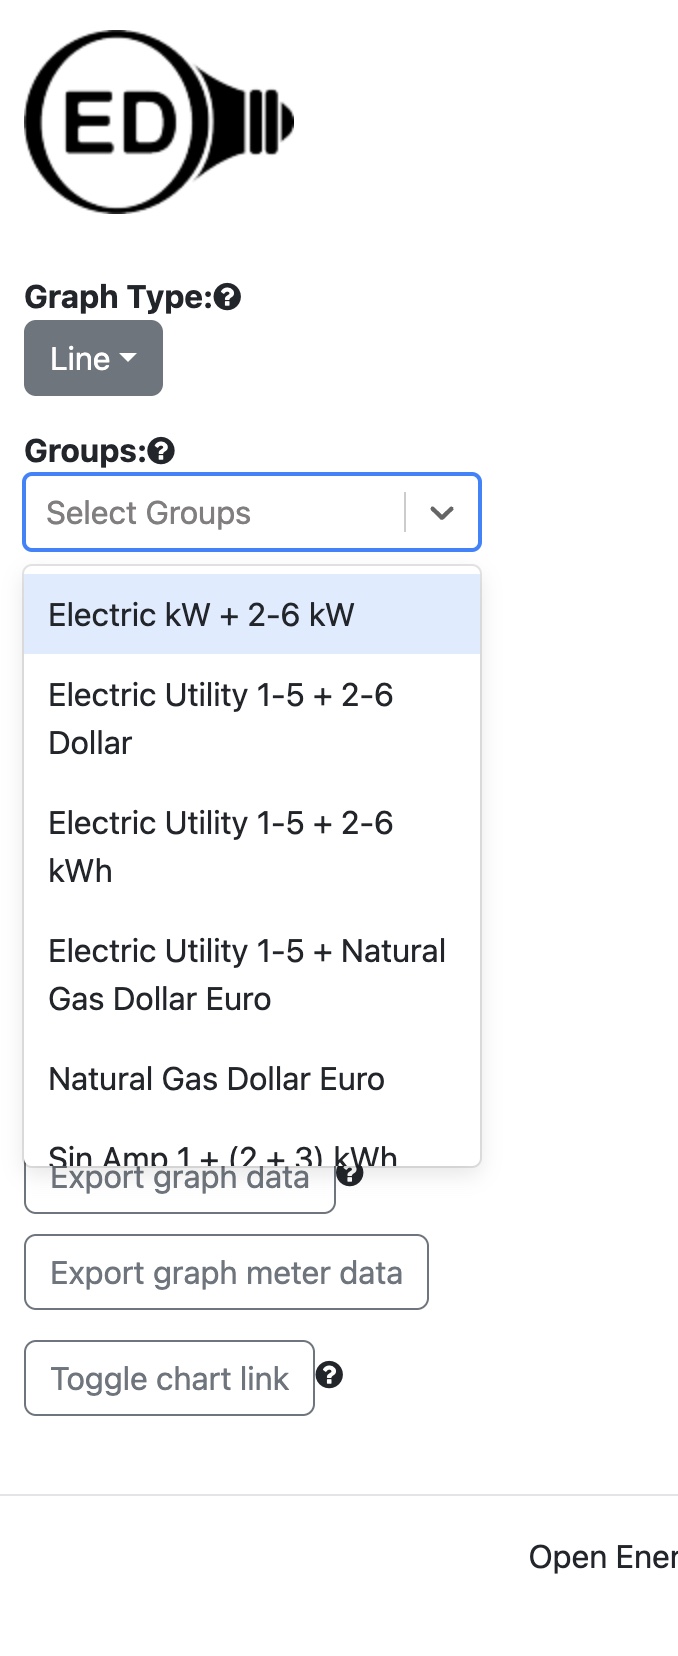
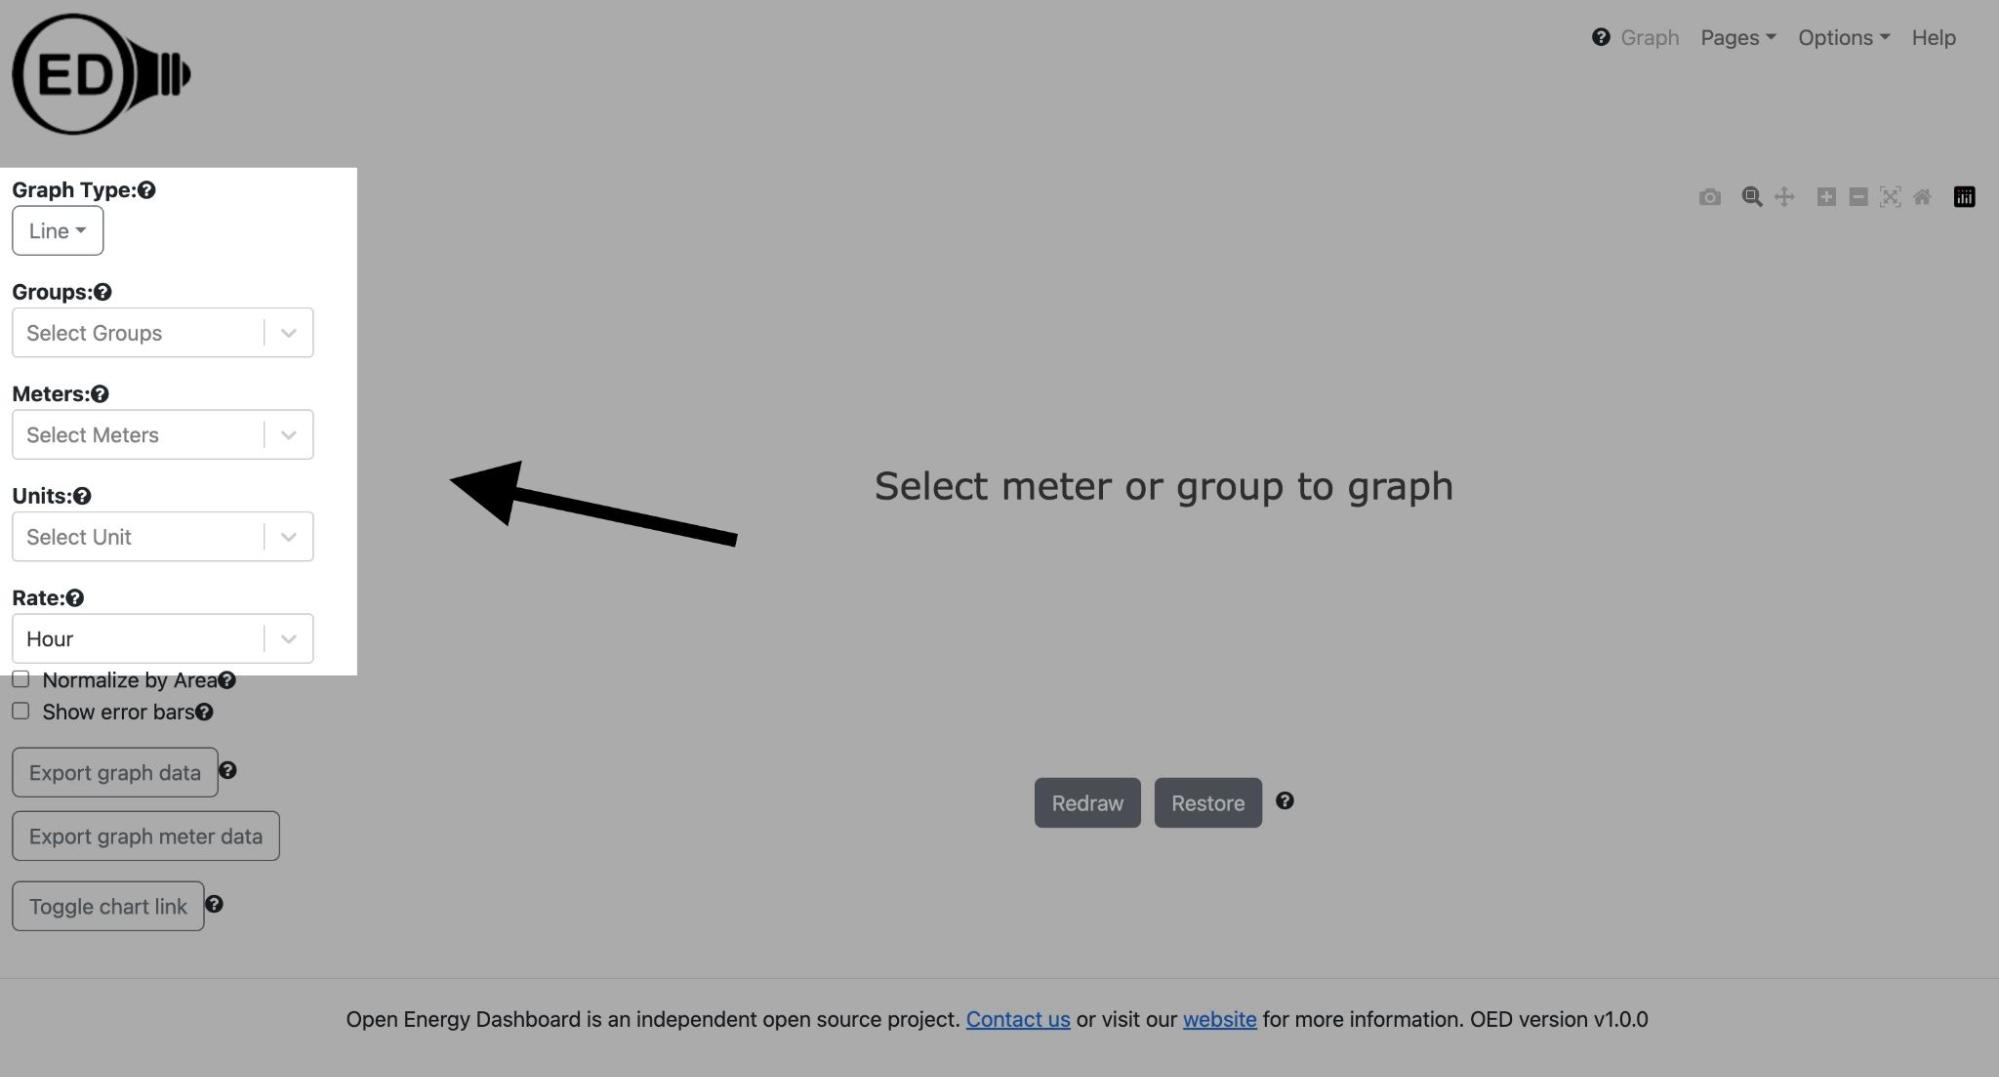
For this example, I am using the site's demo and these are a few of the options available.
3.
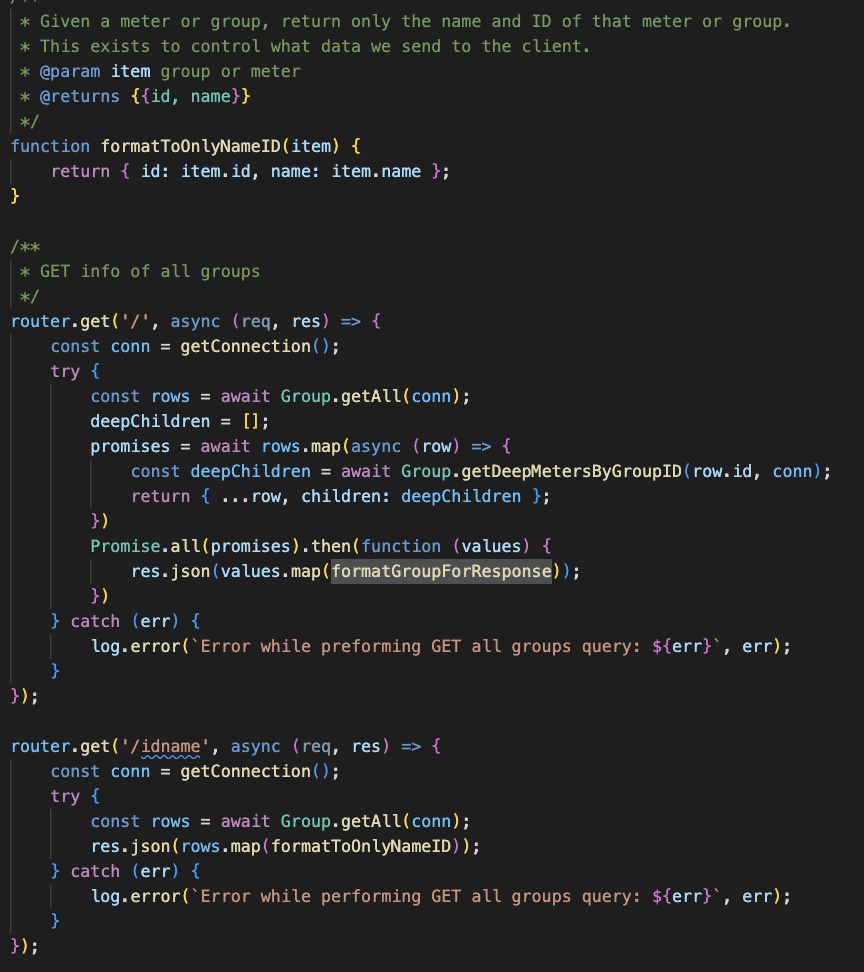
After receiving formatted data, the app returns the groups/meters information back to the client.
4.
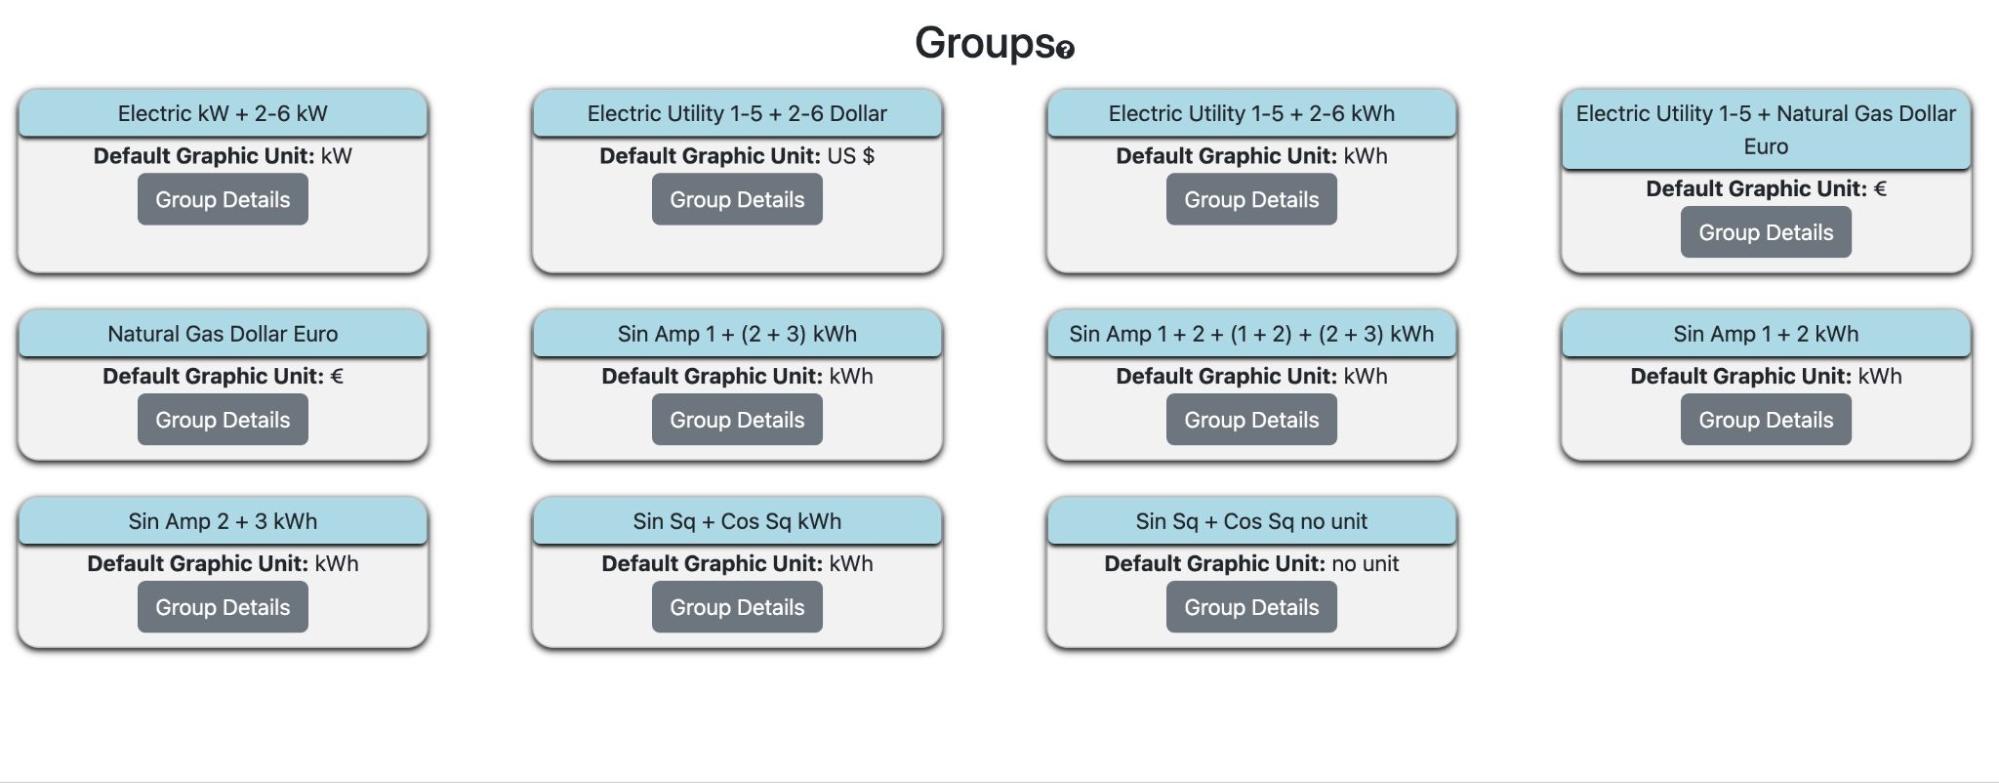
The groups/meters information can be viewed when navigating to the groups or meters page.
Issues
The primary challenge encountered during this project was adapting to new technologies. I had a mere two weeks to familiarize myself with JavaScript in order to effectively implement the code. Additionally, integrating my test cases proved to be challenging, as it necessitated running the code within their Docker container and utilizing the Mocha and Chai framework, which were entirely new to me.
Solving the issue:
Phase 1
Finding the starting point
The issue I was assigned to was on implementing the LG10 test cases in JavaScript that would be used to verify that the correct readings are being returned by the applications API. Navigating to OEDs repository “DesignDocs”, their testing.md file provides information on each test case as well as a step-by-step guide on the directions we need to follow in order to correctly implement the test case; this includes the units and conversions our each test case needs in order to function properly.
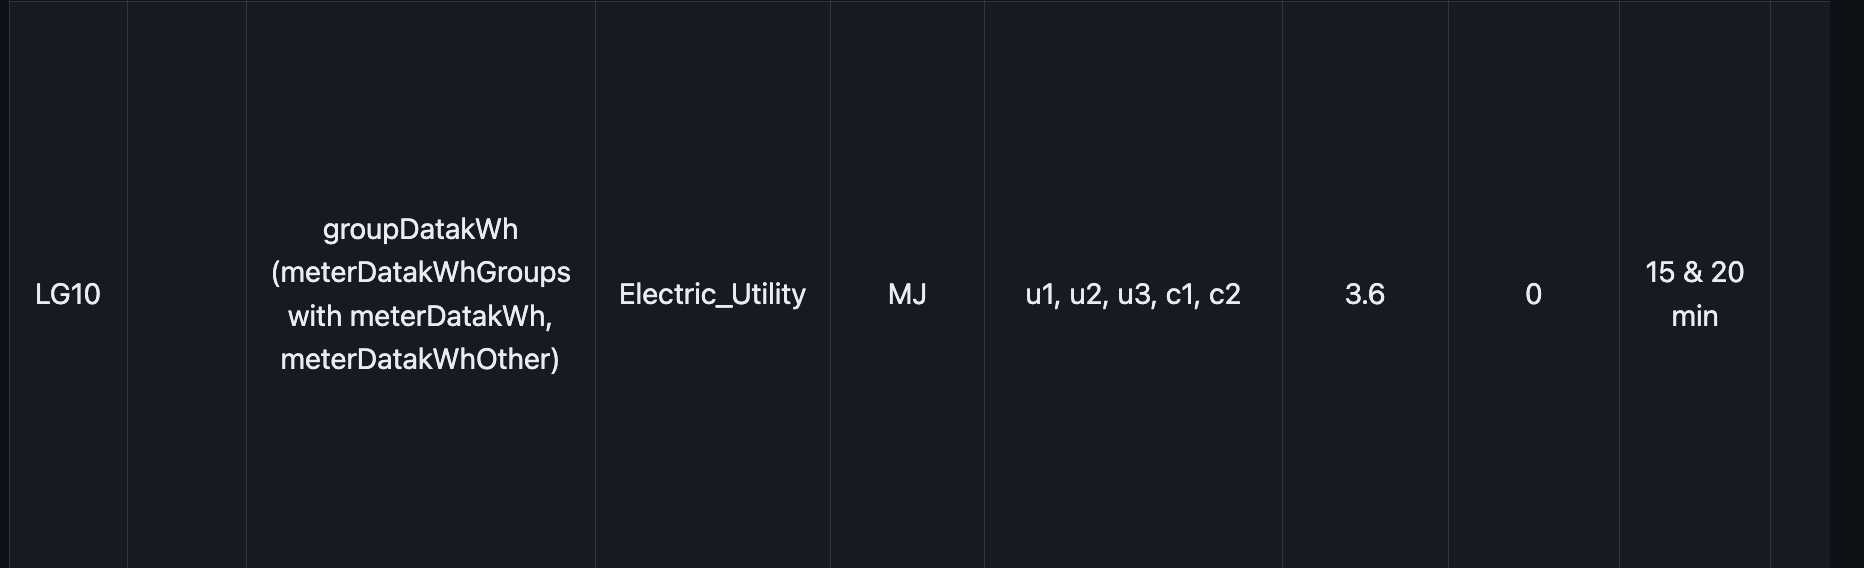
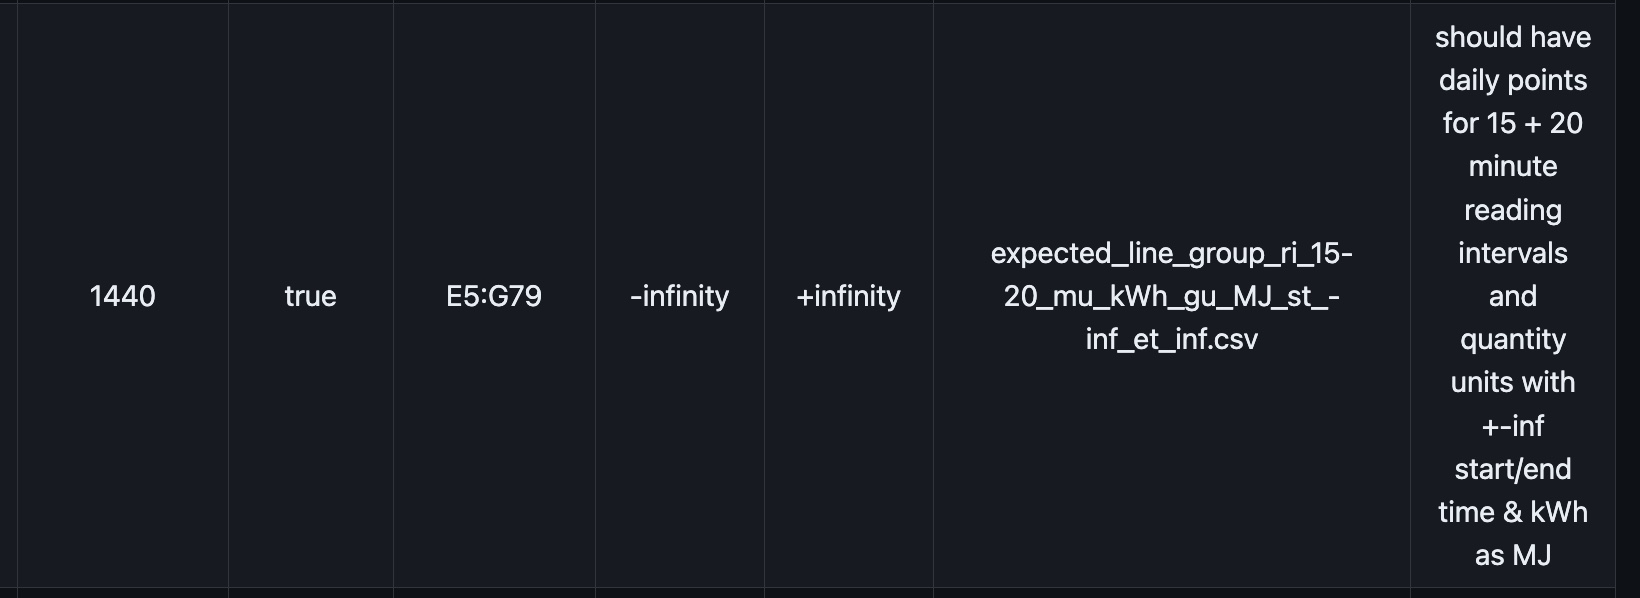
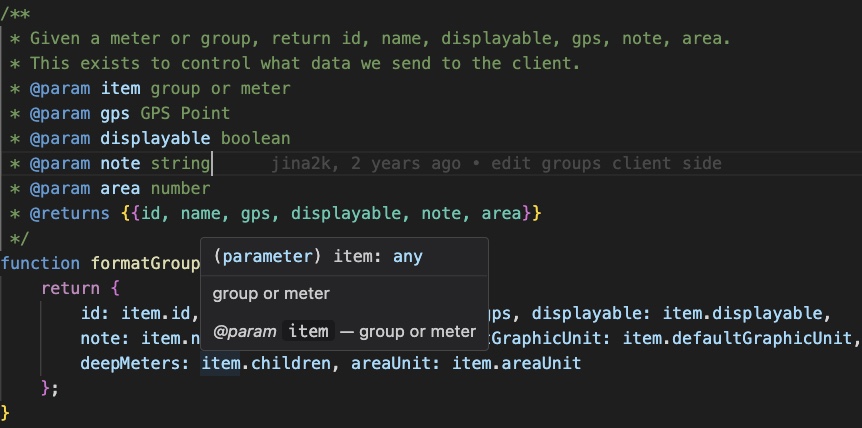
The parameters our testcase (LG10) requires.
The file then informs us of the location of where our test case goes, which is the readingsLineGroupQuantity.js file from the OED repository.
To better understand what our task was and what the code was doing, I created a document page for my team to use as a way to add any new information or just as a way to get a better understanding of everything. (LG10 Info)
Phase 2
Implementing our solution
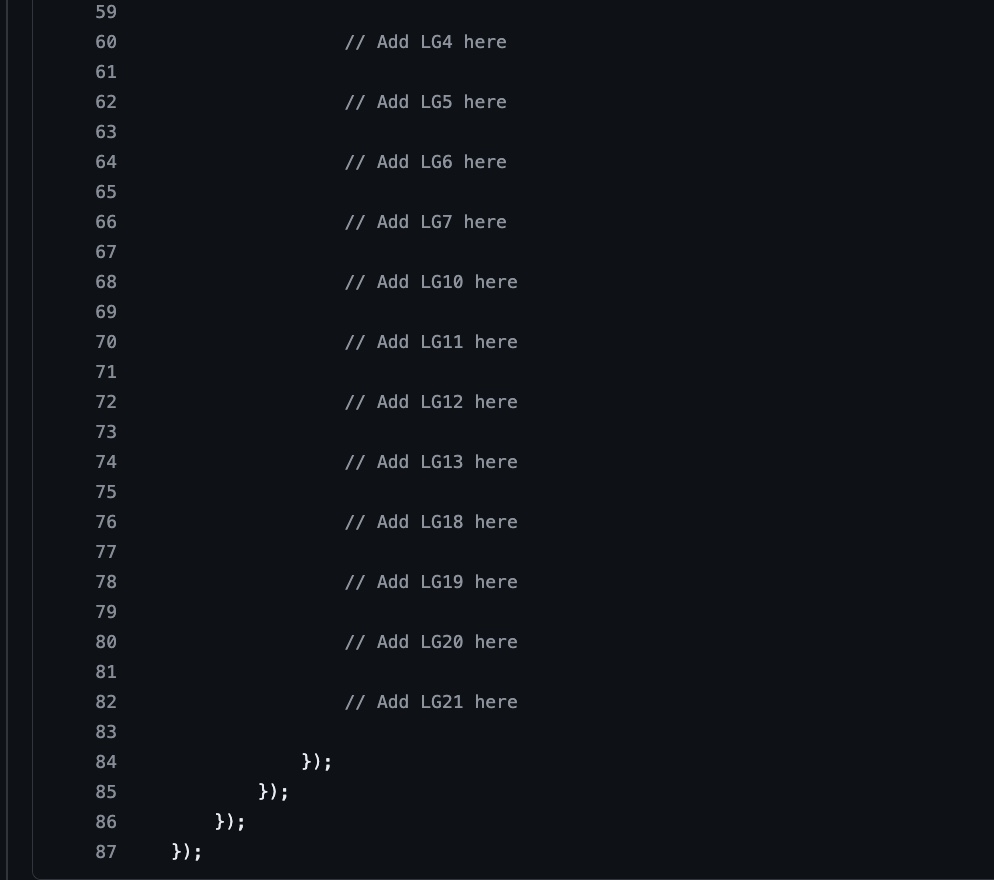
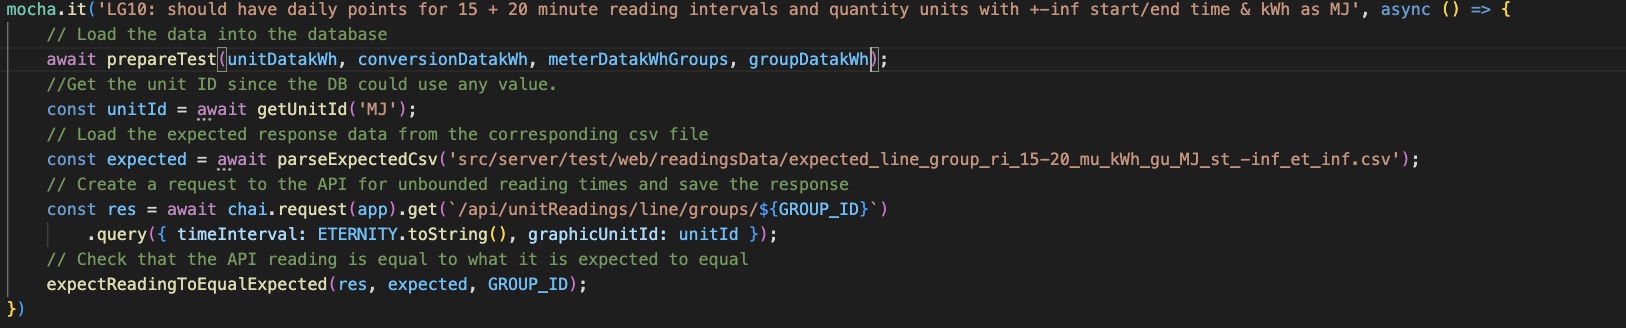
Starting off our implementation, we created the base of our code off of the previous example, LG1, but only changed the description, unitId, and expected readings csv since the rest fit our description. This portion stores the units and conversions into a database so that we have access. Then it grabs the expected results from a csv file and grabs the readings returned from the API. Finally, both results are compared to each other at the end.
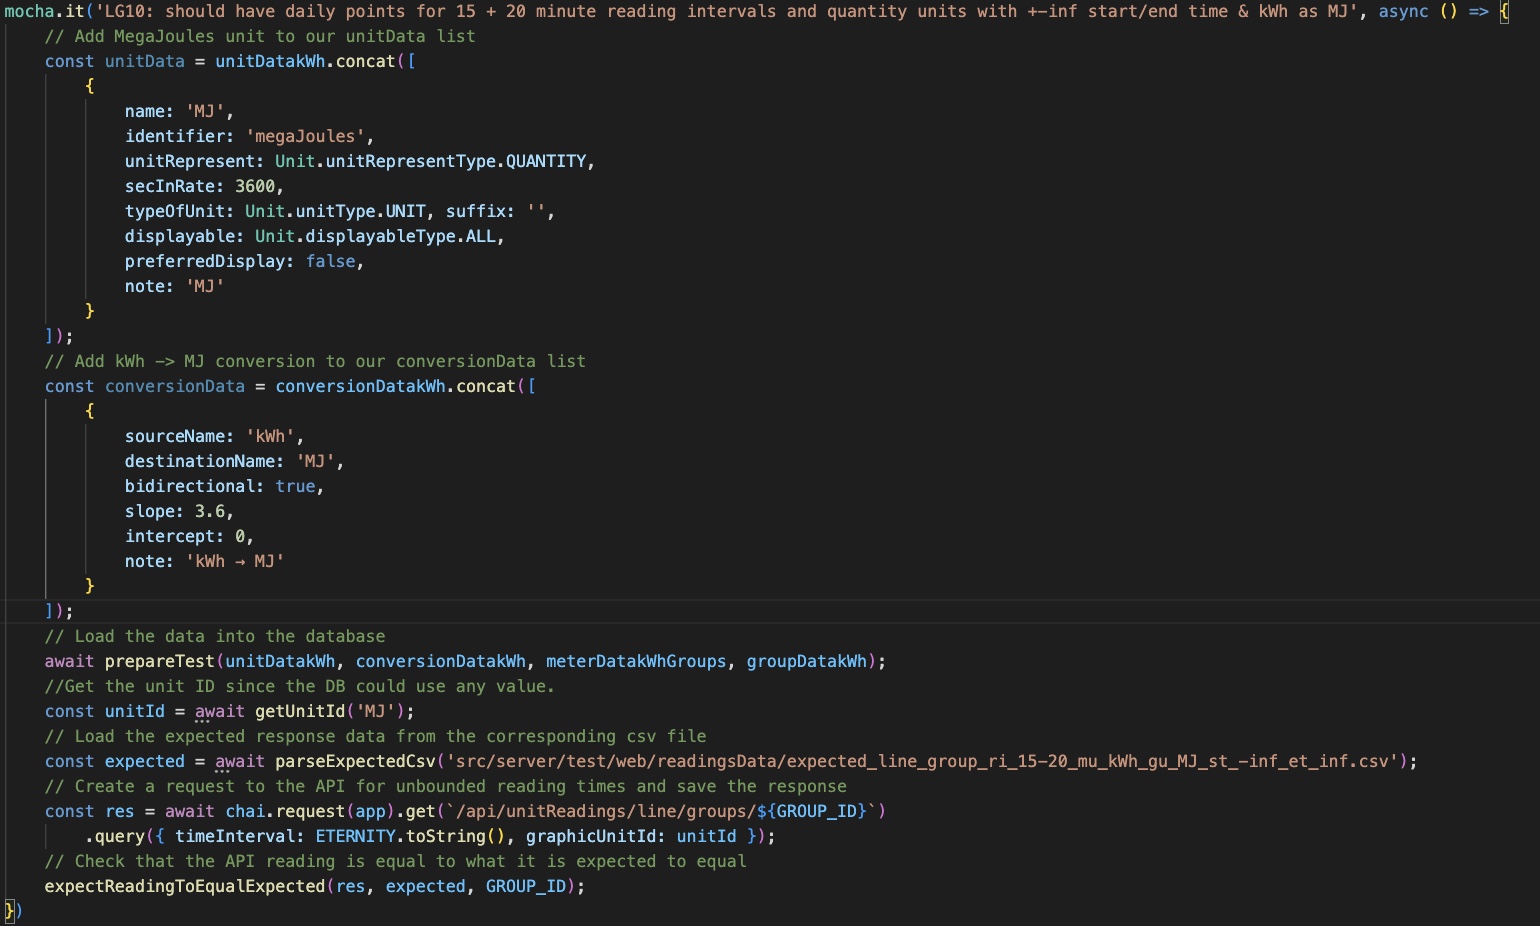
Since our test case required more units and conversions, I read in the testing.md file that, “For any other values needed, the JSON object given can normally be included in the unitData used in the test where unitDatakWh.concat() is used if also including the standard kWh unit.”, which is also the same for conversionDatakWh. Using the concat method, I grabbed the definitions of our units and conversions and added them with the rest of the definitions.
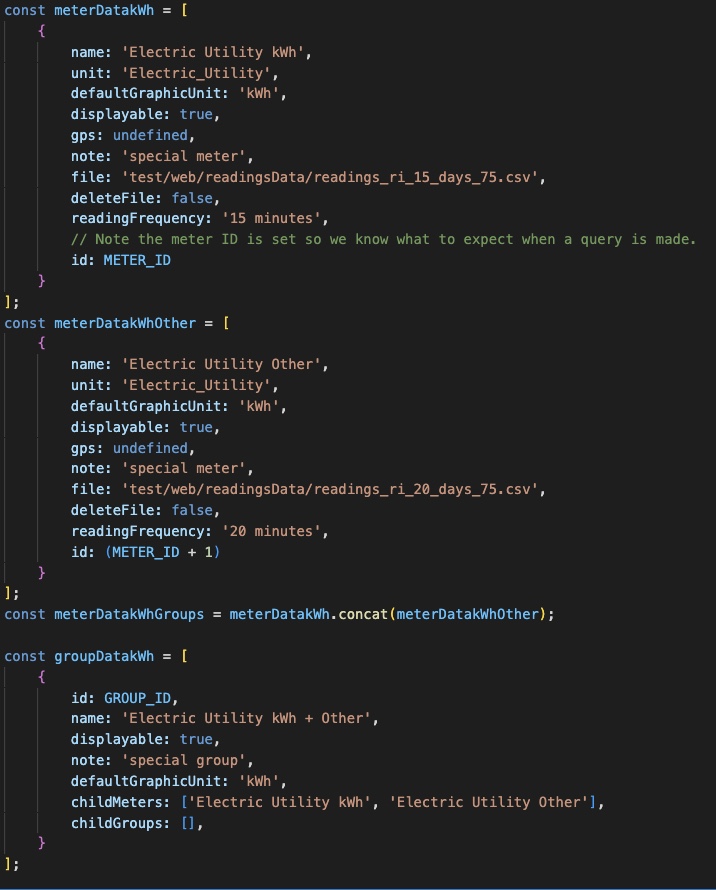
My approach for implementing the correct meter and group data was by digging into how the methods work. The definitions can be found in the readingsUtils JavaScript file.
The meter data includes electricity utility as kWh for 15 and 20 minutes and the group data formats the meter data into childMeters.
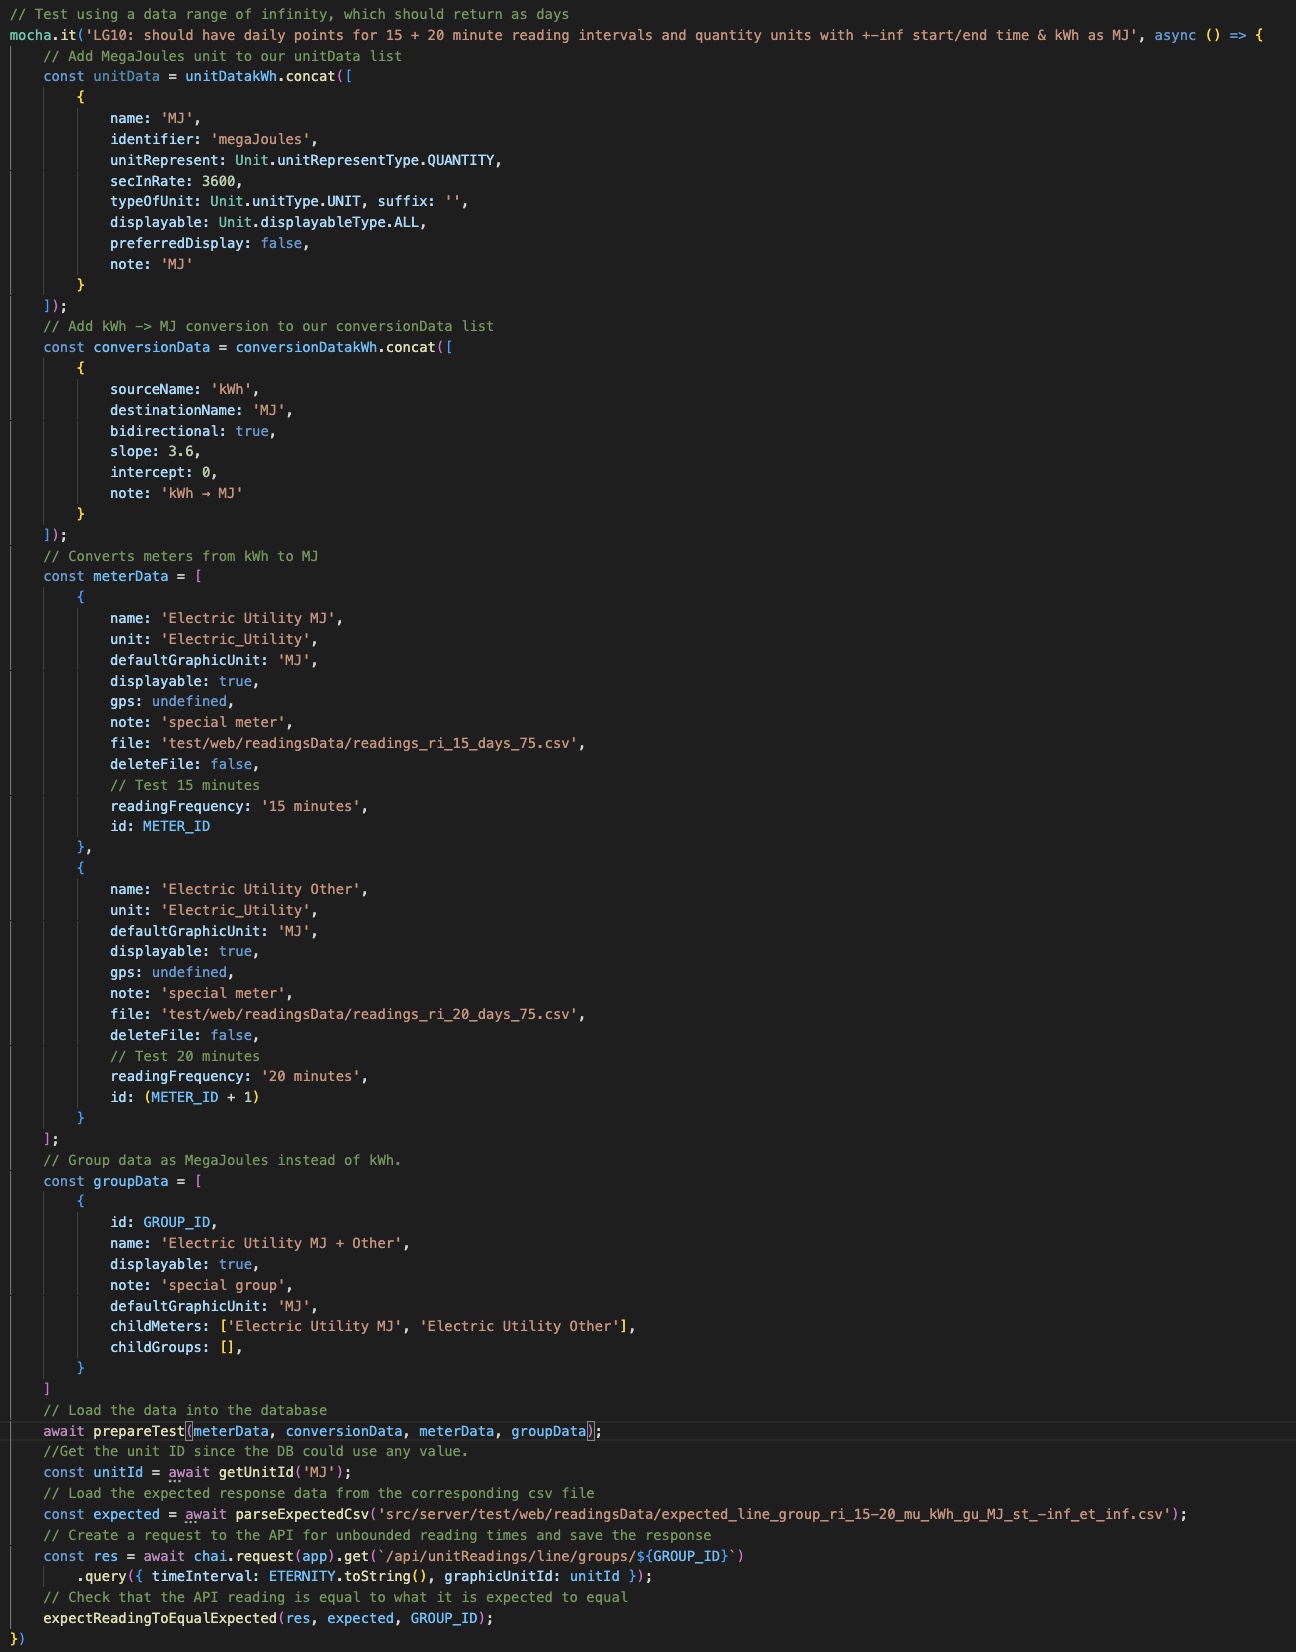
Using this template, I implemented the correct Unit for my test case and finalized my solution.
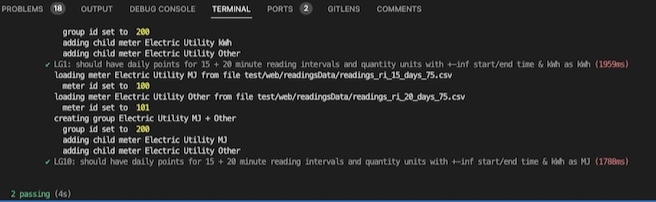
Solution: